
In a world which increasingly relies on the internet for pretty much everything from funny pictures of kittens to complex Super Annuation calculations (ask @alexjmackey about fun with those), the modest web browser is not so modest anymore. Gone are the days of cumbersome web apps with full page reloads and spinning gifs (and who could ever forget <blink>Awesome Sauce!</blink>). Today web applications has to work on desktop, tablet and mobile formats. They have to work across all modern browsers (and sometimes in some archaeological ones too), be lightweight, responsive and unit tested.
As a software developer you have to be aware of all these areas when you set out to build the next web app of the future. You will most likely have specifications to build after, but what tools can help you really excel in your build process? Below I have listed some of the tools which have helped me nail some issues, or made some tasks much much easier. Let me know in the comments, if you have other tools that are awesome/interesting.
User Agent Overrides
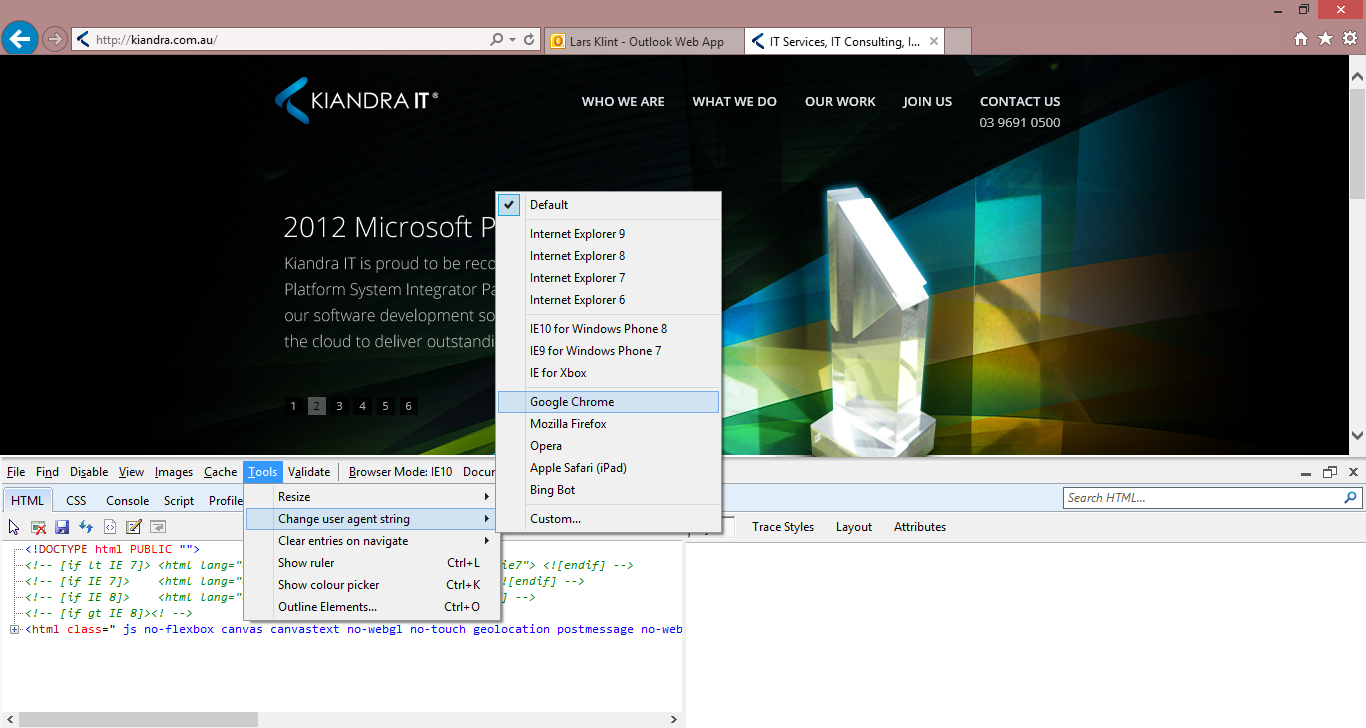
Because the web is now available via pretty much every device with a screen, as a developer you have to accommodate all these different resolutions. You have to make sure your latest post on Estonian knitting looks awesome on a PC, a MacBook air, an iPhone, Nokia’s Latest Windows Phone and many other devices. All of these devices have different user agents, which tell the browser which device it is. The browser and, more importantly, the requested web site can then change it behaviour accordingly.
In Google Chrome you can access the user agent overrides via the Dev tools settings. Hit F12 and go to settings in the lower right hand corner (little cog).
On the settings screen select “Overrides”

Here you can override the user agent and the screen size. This is really handy to simulate all your target devices, and it actually works!
Similar functionality is available in Firefox via a plugin, or in Internet Explorer via the developer tools as well (that is via F12 too).
Page Speed
One of the key ingredients to a successful website is performance. As the below infographic from StrangeLoop indicates, just a 1 second delay in page load time can decrease customer satisfaction by 16% and almost half of visitors will not return to a poorly performing site. On top of that web users now expect the site to work equally fast on mobile devices. Major sites like Google and Yahoo records increase in traffic in the millions for just getting fractions of a second faster page loads. Yes, page load and performance are truly important on all platforms.

Fear not, Page Speed to the rescue! This add on to your developer tools in Chrome made by Google (there is also a FireFox version) instantly gives you an insight into yours or anyone’s site performance.

Once you click on the “Start Analysing” button, the site will reload and all manners of metrics will be recorded. The really cool thing is that you don’t just get a bunch of numbers for sections or areas. All of the data is presented as suggestions on what to improve and how to improve it. Very cool.

You can immediately tackle the high priority items, and prioritise the rest.
WhatFont
One of the pain points of developing smick looking web sites for your local Russian dance association is to deal with fonts. Fonts can be missing, they can be overridden they can be served from different sources. It all makes it complex to keep track of. WhatFont lets you inspect fonts on a page with ease.

Very simple, very easy to use. Makes the font task easy to handle.
Knockoutjs Context Debugger
There are a lot JavaScript frameworks around, and they can do vastly different things. There is the omnipresent jQuery, the pweetty and versatile three.js and the more interestingly named pyjamas and handlebars.
A framework I am starting to really get the hang of is Knockout. It is an MVVM framework, which makes all the JavaScript magic so much easier. Using a viewmodel, your front end code becomes very dynamic and updates through binding of properties. The problem with this is that all of the bound properties and code becomes hidden or obfuscated. Knockout Context Debugger to the rescue! This is a Chrome exclusive plugin that I was made aware of my @Nazulu.
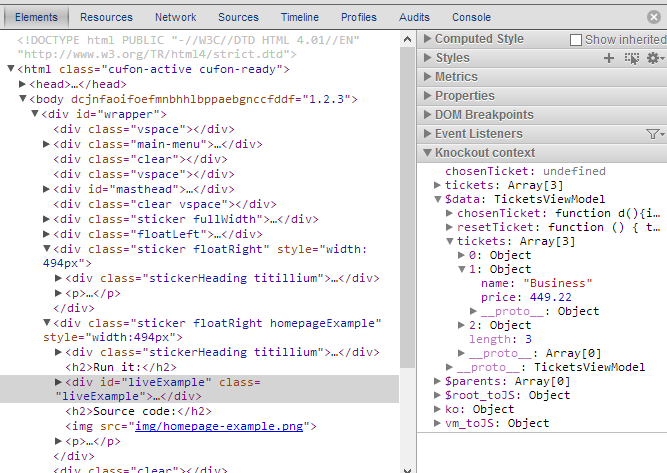
It installs as an extra section in your developer tools, which is accessible on the elements tabs. Select an element that has knockout binding to it, and watch the magic JS fairies populate your knockout context section. It is extremely valuable if you work with Knockout.
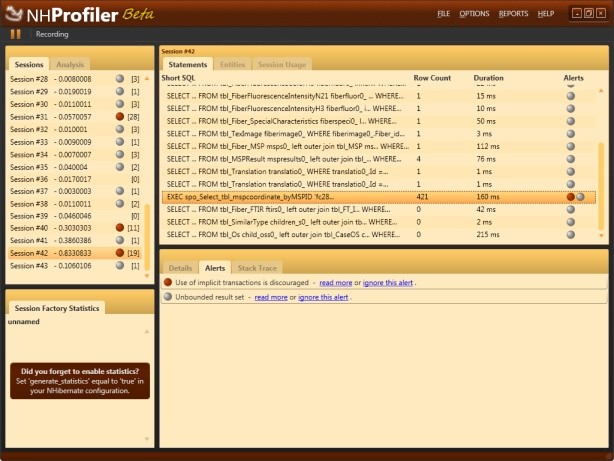
NHProf
Going hand in hand with performance of a web site is the server side response time. Often the backend of a website has some form of database interaction, whether you are storing recipes or the latest AFL results. If this database connection is slow, your site will be slow. A large majority of sites will be using an ORM to help interaction with the database. One of the more popular ORMs is NHibernate.
Although it is not a browser tool, I use NHProf every time I use the browser to optimise performance. NHProf is a profiling tool for the SQL executed on the database using NHibernate. Because NHibernate makes it difficult to see exactly what is being executed, optimising your NHibernate code is sometimes difficult. But with NHProf you can see exactly what was sent to the database and perform detailed analysis of the queries and results.
The licensing for NHProf is a bit on the expensive side, but the benefits are huge if you are serious about database performance.